Refers to the potential for genetic variants (including single nucleotide polymorphisms (SNPs)) to associate with multiple phenotypes.
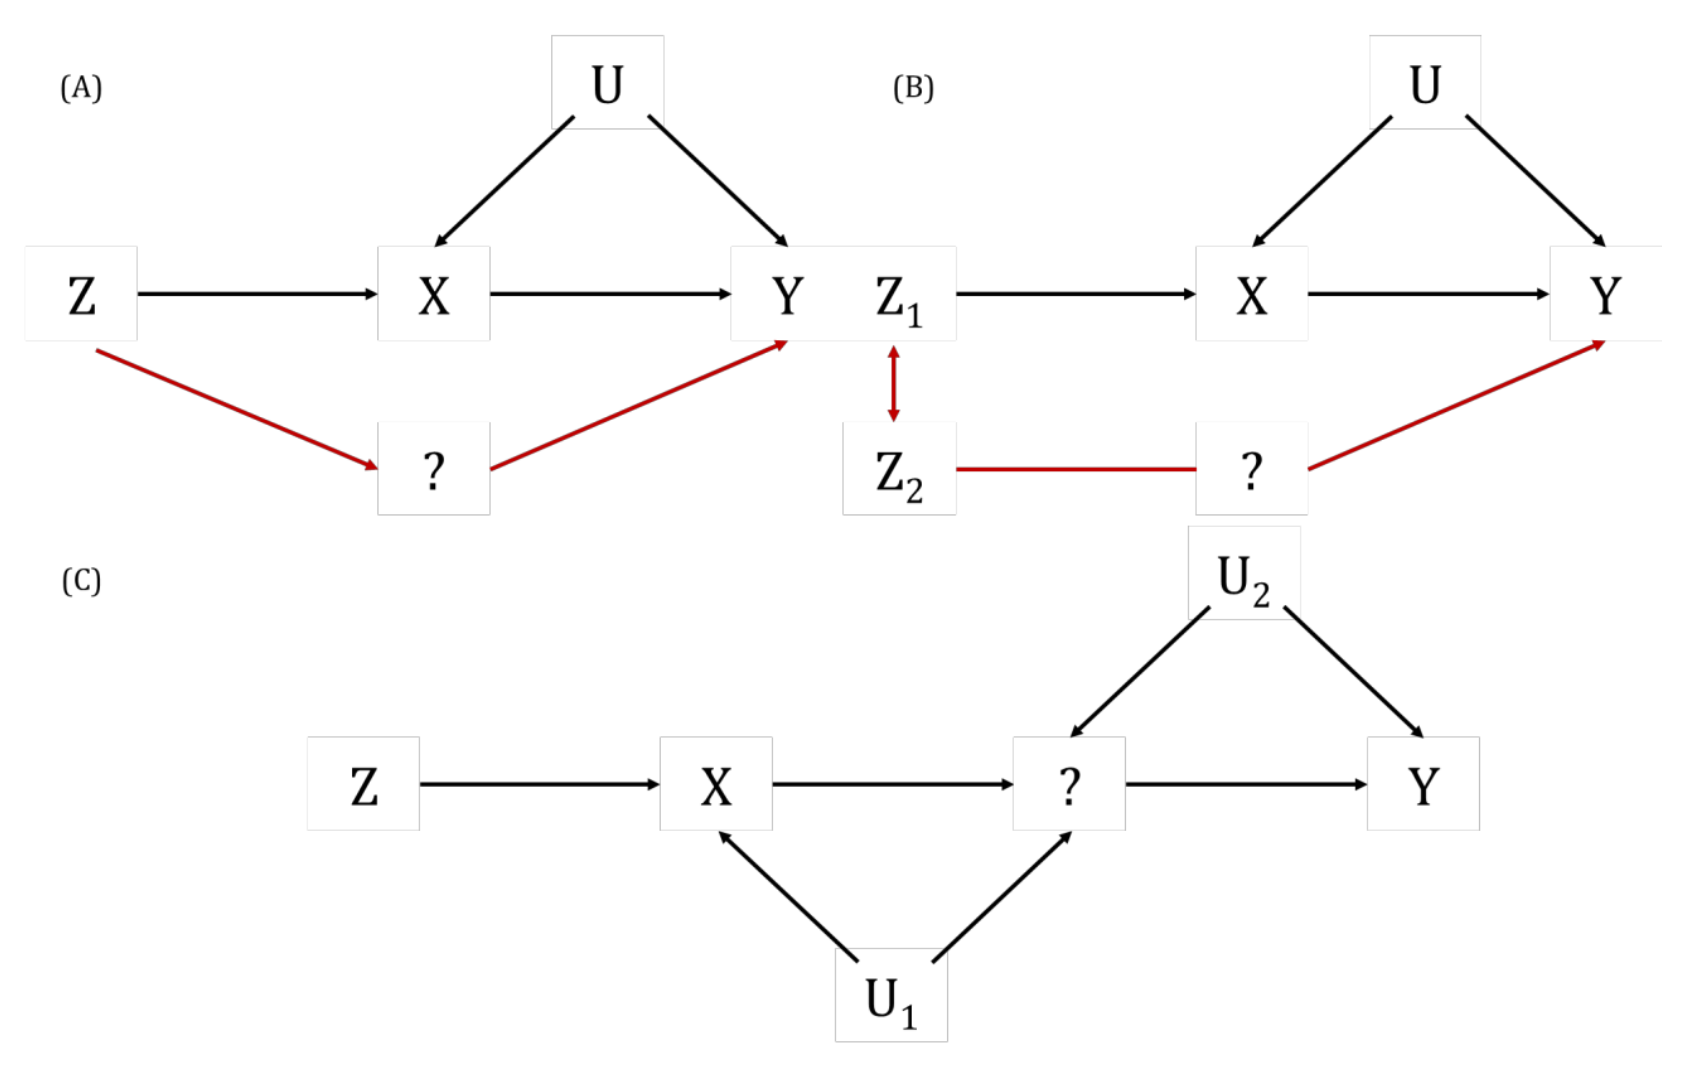
The relevance of a SNP being pleiotropic to an MR study is context-specific. If the SNP is pleiotropic because it influences the outcome only through the exposure of interest (trait A), this is known as vertical pleiotropy and is the exact phenomenon that MR seeks to detect. If the same variant is associated with another exposure (trait B) and the variant only influences the outcome through trait B, then the variant would be exhibiting horizontal pleiotropy in an MR analysis of trait A on the outcome. This would result in violation of the exclusion restriction and, hence, bias of the MR effect estimate. A further complication is the distinction between correlated and uncorrelated pleiotropy. Correlated pleiotropy is most likely to occur if the genetic variants being used as an instrumental variable (IV) influence both the exposure and outcome through a heritable shared factor (e.g., a confounder of the exposure and outcome association). Uncorrelated pleiotropy occurs when the genetic variants being used as an IV influences the outcome in a manner that is independent from the exposure. There are nuanced ways in which correlated and uncorrelated horizontal pleiotropy can bias causal estimates derived from MR analyses and, in the context of two-sample MR, the correlated mechanism by which genetic variants influence the outcome can lead to violation of other assumptions (e.g., the INstrument Strength Independent of Direct Effect (InSIDE) assumption).
References
- Sanderson E, Glymour MM, Holmes MV, Kang H, Morrison J, Munafò MR, Palmer T, Schooling MC, Wallace C, Zhao Q, Davey Smith G. Mendelian randomization. Nat Rev Methods Primers 2022; 2: 6.
- Davey Smith G, Hemani G. Mendelian randomization: genetic anchors for causal inference in epidemiological studies. Hum Mol Genet 2014; 23: R89-R98.
- Zheng J, Baird D, Borges MC, et al. Recent Developments in Mendelian Randomization Studies. Curr Epidemiol Rep 2017; 4: 330-345.
Other terms in 'Sources of bias and limitations in MR':
- Assortative mating
- Canalization
- Collider
- Collider bias
- Conditional F-statistic for multiple exposures
- Confounding
- Exclusion restriction assumption
- F-statistic
- Harmonization (in two-sample MR)
- Homogeneity Assumption
- Horizontal Pleiotropy
- Independence assumption
- INstrument Strength Independent of Direct Effect (InSIDE) assumption
- Intergenerational (or dynastic) effects
- Monotonicity assumption
- MR for testing critical or sensitive periods
- MR for testing developmental origins
- No effect modification assumption
- NO Measurement Error (NOME) assumption
- Non-linear MR
- Non-overlapping samples (in two-sample MR)
- Overfitting
- Population stratification
- R-squared
- Regression dilution bias (attenuation by errors)
- Relevance assumption
- Reverse causality
- Same underlying population (in two-sample MR)
- Statistical power and efficiency
- Vertical pleiotropy
- Weak instrument bias
- Winner's curse